Ratnadeep Retail: fresh issue up to ₹400 crore + promoter OFS
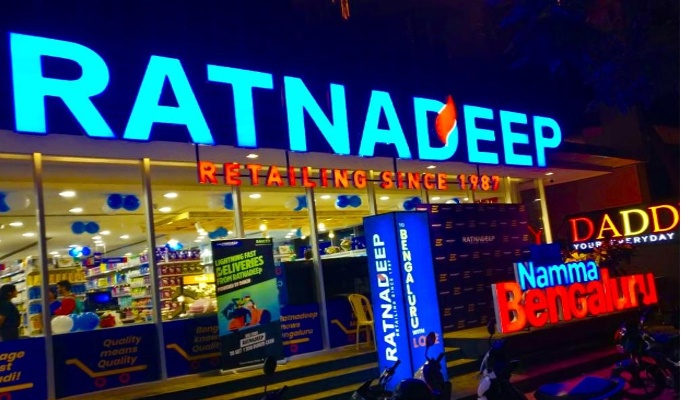
Independent report content
| OFFER | Fresh issue up to ₹400 crore + OFS of up to 1,48,60,000 shares (promoters Sandeep Agarwal 85,44,500; Manish Bhartiya 31,57,750; Mitesh Bhartiya 31,57,750); face value ₹1; optional pre-IPO up to ₹80 crore (Business Today) |
|---|---|
| STATUS | DRHP filed 1 Jul 2026 · SEBI approval 27 Oct 2026, valid 12 months · price band, lot size and dates not announced (Chittorgarh, updated 30 Oct 2026) |
| LEAD MANAGERS | Motilal Oswal Investment Advisors, Axis Capital, DAM Capital Advisors; registrar KFin Technologies |
| OBJECTS (₹ CRORE) | New Ratnadeep and National Mart stores 260.03 · repay loans 40.00 · general corporate purposes (balance) |
| FY26 (REVENUE FROM OPERATIONS ₹2,223.14 CRORE) | EBITDA ₹111.33 crore (5.0%) · profit ₹36.70 crore (1.65%) vs loss of ₹26.69 crore in FY25 and profit of ₹15.84 crore in FY24 |
| NETWORK | 190 stores across 20 cities in Andhra Pradesh, Telangana and Karnataka; 1.21 million sq ft; formats Ratnadeep (supermarket / Select) and National Mart hypermarkets with Style Mart fashion |
| RANGE | More than 30,000 SKUs; 2,321 private-label SKUs, 28.23% of FY26 revenue from operations |
| BALANCE SHEET (31 MAR 2026) | Net worth ₹136.50 crore · borrowings ₹168.83 crore · debt/equity 1.22 · ROE 30.8% · ROCE 17.8% |
| THE ACCESS POINT Ratnadeep Retail is unlisted with SEBI approval. The IPO is the route once the price band is announced. The 12-month validity runs to about October 2027. |
|---|
Executive decision summary
| THE BOTTOM LINE Ratnadeep Retail is a Hyderabad-based chain of 190 supermarkets and hypermarkets in Andhra Pradesh, Telangana and Karnataka. FY26 revenue from operations was ₹2,223 crore (up 11.8%), EBITDA ₹111 crore and profit ₹36.7 crore, a recovery from a ₹26.7 crore loss in FY25. The offer combines up to ₹400 crore of new shares, of which ₹260 crore opens stores and ₹40 crore repays loans, with a promoter sale of 1.49 crore shares. The business has the standard supermarket profile: low margin, high turnover, rent-heavy and concentrated in one region, with 28% of revenue from private labels. The decisive facts are the price band, lease obligations and same-store growth, none of which are in the sources read. |
|---|
| WHICH INVESTOR Fits you IF you want a regional organised-grocery operator with a recovering margin and an explicit store-expansion plan funded by the issue. Look elsewhere IF you want proven profitability across cycles: FY25 was a loss and the FY26 margin is 1.65%. |
|---|
| COMFORT FIT Ratnadeep = a regional DMart: neighbourhood supermarkets and big-box stores with a private-label push, but smaller and thinner-margin. DMart (Avenue Supermarts), Vishal Mega Mart, Spencer's, Trent = listed retailers named in the DRHP. The fresh issue = money to open 260 crore of new stores. |
|---|
| THE RUPEIA NUMBER ₹36.7 crore. FY26 profit, after a ₹26.7 crore loss in FY25: a swing of ₹63.4 crore on revenue of ₹2,223 crore. |
|---|
1 CLAIM REGISTER: EVIDENCE GRADING
A = government or regulator record. B = statutory filing. C = independent press. D = company announcement.
| Claim | Source | Grade | Rupeia assessment |
|---|---|---|---|
| Fresh issue ≤₹400 crore; OFS ≤1,48,60,000 shares by three promoters; face value ₹1 | Chittorgarh; Business Today | A/B | Established. |
| SEBI approval 27 Oct 2026, valid 12 months; DRHP 1 Jul 2026 | Chittorgarh | B | Chittorgarh page last updated 30 Oct 2026. |
| Objects: stores ₹260.03 crore, loans ₹40.00 crore | Chittorgarh; Business Today | B | Total ₹300.03 crore; ₹99.97 crore of gross issue not explained. |
| Revenue from operations ₹1,680.04 / 1,987.72 / 2,223.14 crore; profit ₹15.84 / (26.69) / 36.70 crore (FY24 / FY25 / FY26) | Kotak Neo; Chittorgarh; Business Today | B | Restated consolidated (Chittorgarh); Kotak peer table is standalone. |
| EBITDA ₹58.71 / 41.89 / 111.33 crore | Chittorgarh; Kotak Neo | B | Established. |
| 190 stores, 20 cities, 1.21 million sq ft; 30,000+ SKUs; 5,373 employees | Kotak Neo; Chittorgarh | B | Store count by state not found. |
| Private label 27.07% / 28.79% / 28.23% of revenue (FY24 / FY25 / FY26) | Kotak Neo (DRHP risk factors) | B | Established. |
| Borrowings ₹168.83 crore; net worth ₹136.50 crore; ROE 30.80% | Chittorgarh | B | Debt/equity 1.22 reported versus 1.24 computed. |
| Peers Avenue Supermarts, Vishal Mega Mart, Spencer's, Trent | Business Today; Kotak Neo | B/C | Peer table dated 16 Jun 2026; mixed standalone/consolidated. |
2 COMPANY OVERVIEW & FOUNDING STORY
Ratnadeep Retail Limited was incorporated in February 1995 and has its registered office in Secunderabad, Telangana. Sandeep Agarwal is Chairman and Managing Director; the promoters are Sandeep Agarwal, Manish Bhartiya, Mitesh Bhartiya, Yash Agarwal and Kavita Agarwal, who hold all shares before the IPO. It had 5,373 permanent employees at 31 March 2026.
The group runs neighbourhood supermarkets under the Ratnadeep name (including Ratnadeep Select, a premium food format) and hypermarkets under National Mart, which houses the Style Mart affordable fashion format. It also runs an online platform, RD Click, with home delivery in eight South Indian cities.
Its supply chain includes two warehouses, two collection centres and a fleet of 85 trucks, with direct sourcing from farmers for fresh produce. The DRHP states that it has no in-house manufacturing and relies on third-party suppliers.
3 TIMELINE
| Date | Event |
|---|---|
| Feb 1995 | Incorporated |
| FY24 | Revenue ₹1,680.0 crore; profit ₹15.8 crore |
| FY25 | Revenue ₹1,987.7 crore (+18.3%); loss ₹26.7 crore |
| FY26 | Revenue ₹2,223.1 crore (+11.8%); EBITDA ₹111.3 crore; profit ₹36.7 crore |
| 1 Jul 2026 | DRHP filed |
| 27 Oct 2026 | SEBI approval |
| 30 Oct 2026 | Price band, dates and listing date still unannounced |
4 OFFER STRUCTURE, SELLERS AND USE OF FUNDS
| Item | Detail | Figure | Comment |
|---|---|---|---|
| Fresh issue | New shares | Up to ₹400 crore | Primary capital to the company |
| OFS | Promoters | Up to 1,48,60,000 shares | 13.6% of 10,92,43,500 pre-issue shares |
| Pre-IPO placement | Optional (Business Today) | Up to ₹80 crore | Not in Chittorgarh |
| Object 1 | New Ratnadeep and National Mart stores | ₹260.03 crore | 65% of the fresh issue |
| Object 2 | Repay loan facilities | ₹40.00 crore | 10% of the fresh issue |
| Object 3 | General corporate purposes | Balance | Gap of ~₹99.97 crore to ₹400 crore unexplained |
| Reservation | Net offer | QIB ≥75%, NII ≥15%, retail ≤10% | Institution-heavy structure |
The three promoter-sellers hold 100% before the issue, so every rupee of OFS is promoter cash-out. The OFS is a smaller share of the offer than the fresh issue but is a meaningful 13.6% of the equity.
| RUPEIA CALCULATION New stores (₹260.03 crore) against a current network of 190 stores and ₹524.32 crore of total assets means the expansion plan is worth about half of today's asset base. If a new store needed, say, ₹2 crore of capex and stock (a Rupeia assumption), ₹260 crore would open about 130 stores, a number the RHP will replace with the real figure. The debt repayment (₹40 crore) is 24% of FY26 borrowings (₹168.83 crore). |
|---|
5 FINANCIAL FORENSICS: FROM LOSS TO MARGIN RECOVERY
| ₹ crore | FY24 | FY25 | FY26 |
|---|---|---|---|
| Revenue from operations | 1,680.04 | 1,987.72 | 2,223.14 |
| Growth | — | +18.3% | +11.8% |
| EBITDA | 58.71 | 41.89 | 111.33 |
| EBITDA margin on revenue (Rupeia) | 3.5% | 2.1% | 5.0% |
| PBT | 15.99 | (26.80) | 38.90 |
| Net profit / (loss) | 15.84 | (26.69) | 36.70 |
| PAT margin | 0.9% | −1.3% | 1.65% |
| Operating cash flow | 26.85 | 30.56 | 107.44 |
| Investing cash flow | (64.69) | (64.30) | (33.53) |
| Financing cash flow | 29.14 | 31.17 | (75.38) |
| Borrowings | 127.69 | 201.01 | 168.83 |
| Net worth | 126.49 | 99.80 | 136.50 |
Revenue growth slowed in FY26, but EBITDA rose 166% on the FY25 base (111.33 ÷ 41.89 = 2.66x) and operating cash flow of ₹107.44 crore almost matched EBITDA (96.5%). Borrowings fell by ₹32.18 crore while capital spending dropped to ₹33.53 crore from ₹64.30 crore, so part of the FY26 improvement is cash discipline rather than store growth. Closing cash was just ₹4.30 crore.
| RUPEIA CALCULATION Operating leverage in action. Revenue grew ₹235.4 crore in FY26 (2,223.14 − 1,987.72) while EBITDA grew ₹69.4 crore (111.33 − 41.89), an incremental EBITDA margin of 29.5% (69.4 ÷ 235.4). That is far above the 5% average margin and cannot be sustained; it reflects the recovery from a poor FY25 and fixed costs spread over a larger base. EBITDA here is struck before rent under Ind AS 116, so lease costs sit below it, and lease liabilities were not found in the sources. |
|---|
6 BUSINESS MODEL & UNIT ECONOMICS
Ratnadeep earns the margin between the cost of goods and the shelf price of food, groceries and general merchandise across a South Indian store network.
| Line | How it earns | Pressure point |
|---|---|---|
| Food and grocery supermarkets (Ratnadeep) | Neighbourhood stores for staples, FMCG and fresh produce | Low margin; rent and wages |
| Ratnadeep Select | Premium food format | Smaller; needs affluent catchments |
| National Mart hypermarkets | Large stores with general merchandise and Style Mart fashion | Capital intensive; apparel inventory risk |
| Private label | About 28% of revenue, 2,321 SKUs | Higher margin; must stay consistent in quality |
| RD Click online | Home delivery in eight cities | Delivery costs |
The category mix matters: the DRHP lists a significant revenue share from FMCG and staples, which are low-margin; private label and apparel carry higher margin and are where profit improvement is expected to come from.
7 MARKET & COMPETITIVE ANALYSIS
| Peer | Status | Position |
|---|---|---|
| Avenue Supermarts (DMart) | Listed | FY26 revenue ₹68,821 crore; P/E 92.0 (Kotak peer table, 16 Jun 2026) |
| Trent | Listed | FY26 revenue ₹20,074 crore; P/E 59.9 |
| Spencer's Retail | Listed | Revenue about ₹1,800 crore; loss-making, P/E not meaningful |
| Vishal Mega Mart | Listed | Named in the DRHP; figures not sourced |
| Reliance Smart, More | Private / part of listed groups | Not named in the sources read |
Peer multiples span from DMart's premium (about 92x) to Spencer's losses. Ratnadeep's revenue is about 3% of DMart's (₹2,223 crore ÷ ₹68,821 crore), so a premium multiple would rest on regional leadership and margin recovery rather than scale.
8 1. THE STORE NETWORK AND THE ECONOMICS PER STORE
| Metric | Figure | Source / note |
|---|---|---|
| Stores (31 Mar 2026) | 190 | Kotak Neo; Chittorgarh; Business Today |
| Cities / states | 20 cities in Andhra Pradesh, Telangana, Karnataka | Kotak Neo |
| Retail area | 1.21 million sq ft | Kotak Neo |
| Average area per store | ~6,370 sq ft | Rupeia (1.21 million ÷ 190) |
| Revenue per sq ft | ~₹18,400 a year | Rupeia crude (₹2,223.14 crore ÷ 1.21 million sq ft) |
| Revenue per store | ~₹11.7 crore | Rupeia (₹2,223.14 crore ÷ 190) |
| EBITDA per store | ~₹0.59 crore | Rupeia (₹111.33 crore ÷ 190) |
| Revenue per employee | ~₹41.4 lakh | Rupeia (₹2,223.14 crore ÷ 5,373) |
| Store count by state, same-store growth | Not found | — |
Crude averages using year-end store count and area; stores opened during the year distort per-store figures.
| RUPEIA CALCULATION Rupeia calculation: with revenue per store of about ₹11.7 crore and EBITDA per store of about ₹0.59 crore, a new store that cost ₹2 crore (an assumption) would take about 3.4 years to recover its capex from EBITDA before rent, at the chain average; at the FY25 EBITDA margin of 2.1% it would take about 8 years. This shows how sensitive the expansion economics are to margin. |
|---|
9 2. PRIVATE LABEL AND CATEGORY MIX
| Year | Private label share of revenue from operations | Implied ₹ crore (Rupeia) |
|---|---|---|
| FY24 | 27.07% | ~455 |
| FY25 | 28.79% | ~572 |
| FY26 | 28.23% | ~628 |
Share from the DRHP risk factors via Kotak Neo; ₹ crore derived from revenue from operations.
Private label has been flat at 27–29% for three years, so the margin recovery in FY26 did not come from a rising private-label share. The mix of SKUs (over 14,000 FMCG, 11,800 general merchandise, 2,300 staples, 1,900 apparel and 335 fresh at March 2026, per Kotak Neo) shows a wide assortment typical of a hypermarket-led chain.
10 3. BALANCE SHEET, LEASES AND CAPITAL ALLOCATION
| Item | FY24 | FY25 | FY26 |
|---|---|---|---|
| Total assets | 428.21 | 510.16 | 524.32 |
| Net worth | 126.49 | 99.80 | 136.50 |
| Borrowings | 127.69 | 201.01 | 168.83 |
| Borrowings ÷ net worth (Rupeia) | 1.01 | 2.01 | 1.24 |
| Closing cash | 8.34 | 5.77 | 4.30 |
| Lease liabilities and interest cost | Not found | Not found | Not found |
₹ crore. Debt/equity of 1.22 reported; 1.24 computed.
The FY25 loss pushed net worth below the FY24 level and debt/equity above 2x. FY26 restored it to 1.24x. The missing item is lease liabilities: supermarkets lease most stores, and under Ind AS 116 rent appears as depreciation and interest, so EBITDA of ₹111 crore overstates cash earnings relative to a rent-inclusive measure.
11 4. VALUATION GRID
| Post-issue value (₹ crore) | P/E on ₹36.70 cr | x revenue ₹2,223 cr | EV/EBITDA* on ₹111.33 cr | Fresh issue ₹400 cr as % of equity |
|---|---|---|---|---|
| 3,000 | 81.7x | 1.35x | 28.4x | 13.3% |
| 4,000 | 109.0x | 1.80x | 37.4x | 10.0% |
| 5,000 | 136.2x | 2.25x | 46.4x | 8.0% |
| 6,000 | 163.5x | 2.70x | 55.4x | 6.7% |
*EV = value + borrowings ₹168.83 crore − cash ₹4.30 crore; excludes lease liabilities (not found), so EV/EBITDA is understated relative to a lease-adjusted measure. No valuation has been published. Rupeia arithmetic.
| RUPEIA CALCULATION Rupeia calculation: at 1.35x revenue (₹3,000 crore) a supermarket with a 5% EBITDA margin would trade at 28x EBITDA before leases. DMart at about 92x earnings is the high end of the range; a regional operator with a 1.65% net margin is unlikely to be priced at that level, so EPS-based multiples will look extreme and the market will look to EV/sales and EV/EBITDA instead. With 10.92 crore pre-issue shares, FY26 EPS is ₹3.36 and NAV ₹12.50. |
|---|
12 5. RISK MAP FOR A REGIONAL GROCERY RETAILER
| Risk | Mechanism | Where to look in the RHP |
|---|---|---|
| Regional concentration | Telangana contributes a major share of revenue; three states in all | Revenue by state |
| Thin and volatile margin | FY25 loss shows how fast margin disappears | Quarterly margin; EBITDA by format |
| Rent and lease burden | Stores are leased; lease liabilities not disclosed in sources | Lease liabilities; rent as % of revenue |
| Competition | DMart, Reliance Smart, More, Vishal and e-commerce | Store overlap by city |
| Category concentration | FMCG and staples dominate revenue | Category margin |
| Third-party supply | No in-house manufacturing | Top supplier dependence |
| Working capital | Inventory and payables swings | Inventory days; cash conversion |
13 6. GOVERNANCE AND OWNERSHIP
Promoter control: promoters and promoter group hold 100% pre-IPO; three of them sell shares in the OFS (Sandeep Agarwal 85.45 lakh, Manish Bhartiya 31.58 lakh, Mitesh Bhartiya 31.58 lakh).
Post-IPO holding: not given; the 13.6% OFS plus the fresh issue will bring promoter ownership below 100%.
Management: Sandeep Agarwal is Chairman and Managing Director; other roles not in the sources read.
Lead managers: Motilal Oswal, Axis Capital and DAM Capital, a large-bank syndicate for a company of this size.
14 7. QUESTIONS FOR THE RED HERRING PROSPECTUS
Price band, lot size, anchor book and the size of any pre-IPO placement.
Store count and revenue by state; same-store sales growth; store-level payback.
Lease liabilities, rent cost and interest expense.
Reconciliation of the ₹99.97 crore gap between the objects and the gross fresh issue.
Number and location of the new stores to be opened with ₹260.03 crore.
Supplier concentration and private-label supplier terms.
Quarterly revenue and margin since April 2026.
Related-party transactions and promoter lock-in.
15 8. GLOSSARY
| Term | Meaning |
|---|---|
| SKU | Stock-keeping unit: one distinct product listing |
| Private label | Products sold under the retailer's own brand |
| Same-store sales growth | Growth in revenue from stores open in both periods |
| Ind AS 116 | Lease accounting standard that moves rent below EBITDA |
| EV/EBITDA | Enterprise value divided by operating earnings |
| OFS / fresh issue | Sale by promoters versus new shares for the company |
16 VALUATION SCENARIOS
| Scenario | Post-issue value (₹ crore) | x revenue | What must be true |
|---|---|---|---|
| Bear | 2,500 | 1.1x | Margin falls back toward FY25; lease burden weighs |
| Base | 3,500 | 1.6x | Margin holds near 5% EBITDA with steady store growth |
| Bull | 5,000 | 2.25x | Same-store growth and private label lift margin |
Rupeia scenarios; no valuation has been published.
17 SCENARIO ANALYSIS
| Scenario | Probability | What happens |
|---|---|---|
| Bull | 25% | Launch in the SEBI window; margin sustained; new stores ramp quickly |
| Base | 45% | IPO near 1.5x revenue; modest growth in stores and profit |
| Bear | 30% | FY27 margin slips or markets weaken; issue delayed |
18 RISK ANALYSIS: RED FLAG LEDGER & KILL CONDITIONS
| Risk | Severity | Kill condition |
|---|---|---|
| Thin margin (1.65% net, 5.0% EBITDA) | High | FY27 quarterly margins |
| Regional concentration (three states, Telangana heavy) | High | Revenue by state |
| Lease burden not disclosed in summaries | High | Lease liabilities and rent |
| Competition from DMart and others | Medium | Store overlaps |
| Leverage (debt/equity 1.2x) | Medium | Net debt after IPO |
| Execution of new store roll-out | Medium | Store openings versus plan |
19 INVESTOR CLASS ANALYSIS
HNIs and family offices
Judge the price against EV/sales and EBITDA, not P/E: net margin is 1.65%. Read the lease note and same-store sales before the band.
Institutions
Institutions will test store-level economics, lease adjusted returns and whether FY26 margin is a base or a peak.
NRIs
NRIs can hold unlisted Indian shares under FEMA pricing and reporting rules; repatriation depends on the account route used.
20 THE EARLY SIGNAL: EVENTS TO WATCH
| When | Event |
|---|---|
| Nov 2026–Oct 2027 | RHP, price band and launch within SEBI validity |
| Post-listing | First quarterly results with same-store data |
| Ongoing | Store openings under the ₹260 crore plan |
21 RUPEIA FINAL INDEPENDENT VIEW
Ratnadeep has scale in its home region, a private-label base and a clear plan to use IPO money on stores. The margin is thin, the history includes a loss year and the key disclosures (leases, same-store growth) are still to come.
| THE RUPEIA NUMBER ₹36.7 crore. FY26 profit, after a ₹26.7 crore loss in FY25: a swing of ₹63.4 crore on revenue of ₹2,223 crore. |
|---|
| RUPEIA VERDICT Recovering regional grocer. Wait for the band and lease note. |
|---|
Frequently asked questions
Has SEBI approved the Ratnadeep Retail IPO?
Yes, on 27 October 2026, valid for 12 months; the price band and dates were not announced in the sources read.
How big is the IPO?
A fresh issue of up to ₹400 crore plus an offer for sale of up to 1.49 crore shares by three promoters.
What are Ratnadeep's revenue and profit?
FY26 revenue from operations ₹2,223.14 crore and profit ₹36.70 crore, after a loss of ₹26.69 crore in FY25.
How many stores does it have?
190 stores across 20 cities in Andhra Pradesh, Telangana and Karnataka.
What will the money be used for?
About ₹260 crore for new stores and ₹40 crore to repay loans, plus general purposes.
Source log
Chittorgarh: Ratnadeep Retail IPO
Kotak Neo: Ratnadeep Retail IPO
Business Today: Swara Baby, TMC Transformers, Ratnadeep Retail file DRHPs
Groww: blog on SEBI approvals and IPOs
| DISCLAIMER This report is independent research by Rupeia Investments Co. built only from public sources as of the date shown. It is not an offer, solicitation or investment advice, and it is not a recommendation to buy or sell any security. Private-company figures are drawn from filings and media reports and may be revised. Unlisted and private-market investments are illiquid and carry a risk of total loss. Investors should take independent advice. |
|---|