Carlsberg India: India's second-largest brewer
Independent report content
| OFFER | Pure offer for sale of up to 8.64 crore equity shares (face value ₹1) by South Asian Breweries Pvt. Ltd.; no fresh issue, so the company receives no proceeds |
|---|---|
| REGULATORY PATH | Confidential pre-filing July 2026 → SEBI observations 1 Oct 2026 → updated DRHP dated 27 Oct 2026 (filed with SEBI 29 Oct, per Groww) |
| LEAD MANAGERS | Kotak Mahindra Capital, Citigroup Global Markets India, J.P. Morgan India; registrar MUFG Intime |
| FY26 (UDRHP, VIA INDMONEY) | Net revenue ₹3,892 crore · EBITDA margin 20.90% · net profit ₹534.5 crore (13.73%) · gross margin 50.03% · adjusted ROCE 61.7% |
| REPORTED SIZE AND VALUE | About US$700m (₹6,600 crore in press) and ₹30,000–35,000 crore valuation: media estimates, not in the filing; no price band yet |
| MARKET POSITION | About 22% share, second to United Breweries (about 50%) and ahead of AB InBev India (about 19%): media estimates |
| CONCENTRATION | Tuborg Strong = 72.6% of FY26 gross sales |
| FOOTPRINT | Seven owned breweries and eight third-party facilities (June 2026, Groww); about 80,000 licensed outlets |
| THE ACCESS POINT Carlsberg India is unlisted and no price band, issue dates or red herring prospectus had been published at the time of writing. The route for investors is the IPO itself once launched. The Carlsberg Group (Denmark) is listed overseas, which gives a different, indirect exposure. |
|---|
Executive decision summary
| THE BOTTOM LINE Carlsberg India is the cleanest large consumer IPO in the SEBI queue: a profitable, cash-generative brewer with a 20.9% EBITDA margin and a 61.7% adjusted ROCE, sold entirely by its parent through an offer for sale of up to 8.64 crore shares. For FY26 the draft prospectus shows net revenue of ₹3,892 crore and net profit of ₹534.5 crore, about 29% more profit than United Breweries (₹413.4 crore) on less than half the revenue. The questions for a buyer are about price and concentration: press estimates put the valuation at ₹30,000–35,000 crore, or 56–65x FY26 profit; Tuborg Strong supplies 72.6% of gross sales; and a June 2026 brand-licence renewal raises the contractual royalty to 4–5% of sales, softened for five years by a side letter that caps the effective rate at 1.8%. Because the parent is the only seller, the investor is buying a business, not funding its growth. |
|---|
| WHICH INVESTOR Fits you IF you want a high-return, profitable branded-consumer business from a global group, bought at the IPO price band, with disclosure that has the depth of a full prospectus. Look elsewhere IF you want a cheap entry or a growth-funding story: this is a secondary sale at a reported premium multiple, and one brand drives most of the sales. |
|---|
| COMFORT FIT Carlsberg India = the number-two beer company in a market where the number one (United Breweries) is already listed. Hyundai Motor India, LG Electronics India, Nestlé India = foreign-parent subsidiaries that listed in India. The OFS = the parent selling part of its own subsidiary to Indian investors, not raising money for the business. |
|---|
| THE RUPEIA NUMBER 72.6%. The share of FY26 gross sales from one brand, Tuborg Strong. |
|---|
1 CLAIM REGISTER: EVIDENCE GRADING
A = government or regulator record. B = statutory filing. C = independent press. D = company announcement.
| Claim | Source | Grade | Rupeia assessment |
|---|---|---|---|
| Pure OFS of up to 8.64 crore shares by South Asian Breweries Pvt. Ltd.; face value ₹1 | Groww (citing the UDRHP-I); IPO trackers | A/B | Established. Selling shareholder named by Groww only. |
| SEBI observations 1 Oct 2026; UDRHP dated 27 Oct 2026 | Groww; Kotak Neo; ipoguru | B | Established; filing date varies 27–30 Oct by source. |
| Net revenue ₹3,892 crore; EBITDA margin 20.90%; PAT ₹534.5 crore; gross margin 50.03%; ROCE 61.7% (FY26) | INDmoney, labelled "Source: Carlsberg UDRHP" | B | Secondary summary of the filing. |
| EBITDA ₹813.25 crore (FY26) and ₹682.55 crore (FY25); PAT ₹437.94 crore (FY25); Q1 FY27 PAT ₹158.23 crore | Groww table | B/C | Table headings unlabelled; EBITDA ties to INDmoney margin (₹3,892 crore × 20.9% ≈ ₹813 crore). |
| Total income ₹8,814.96 crore (FY26), ₹9,018.15 crore (FY25) | Groww table | C | Differs from net revenue; the gap is consistent with total income including excise duty, which Rupeia infers but the sources do not state. |
| Tuborg Strong = 72.6% of gross sales | INDmoney | B | Reported. |
| Royalty: 2006 agreement at about 1.8% effective; June 2026 renewal at 4% (Tuborg) and 5% (Carlsberg), with a five-year side letter capping the effective rate at 1.8%; about ₹90 crore paid in FY26 | INDmoney | B/C | The ₹90 crore does not reconcile with 1.8% of either revenue measure; see section 6. |
| Valuation ₹30,000–35,000 crore; size about US$700m | Whalesbook; Reuters as cited by INDmoney | C | Estimates only; Whalesbook carries an AI-content disclaimer. |
| Market shares: United Breweries ~50%, Carlsberg ~22%, AB InBev ~19% | INDmoney ("media reports") | C | Unverified estimates. |
| Seven owned breweries and eight third-party facilities (June 2026); earlier reports cite eight owned (Feb 2025) and 14 in total | Groww; Just Drinks; Global Drinks Intel | C | Counts conflict; see section 4. |
2 COMPANY OVERVIEW & FOUNDING STORY
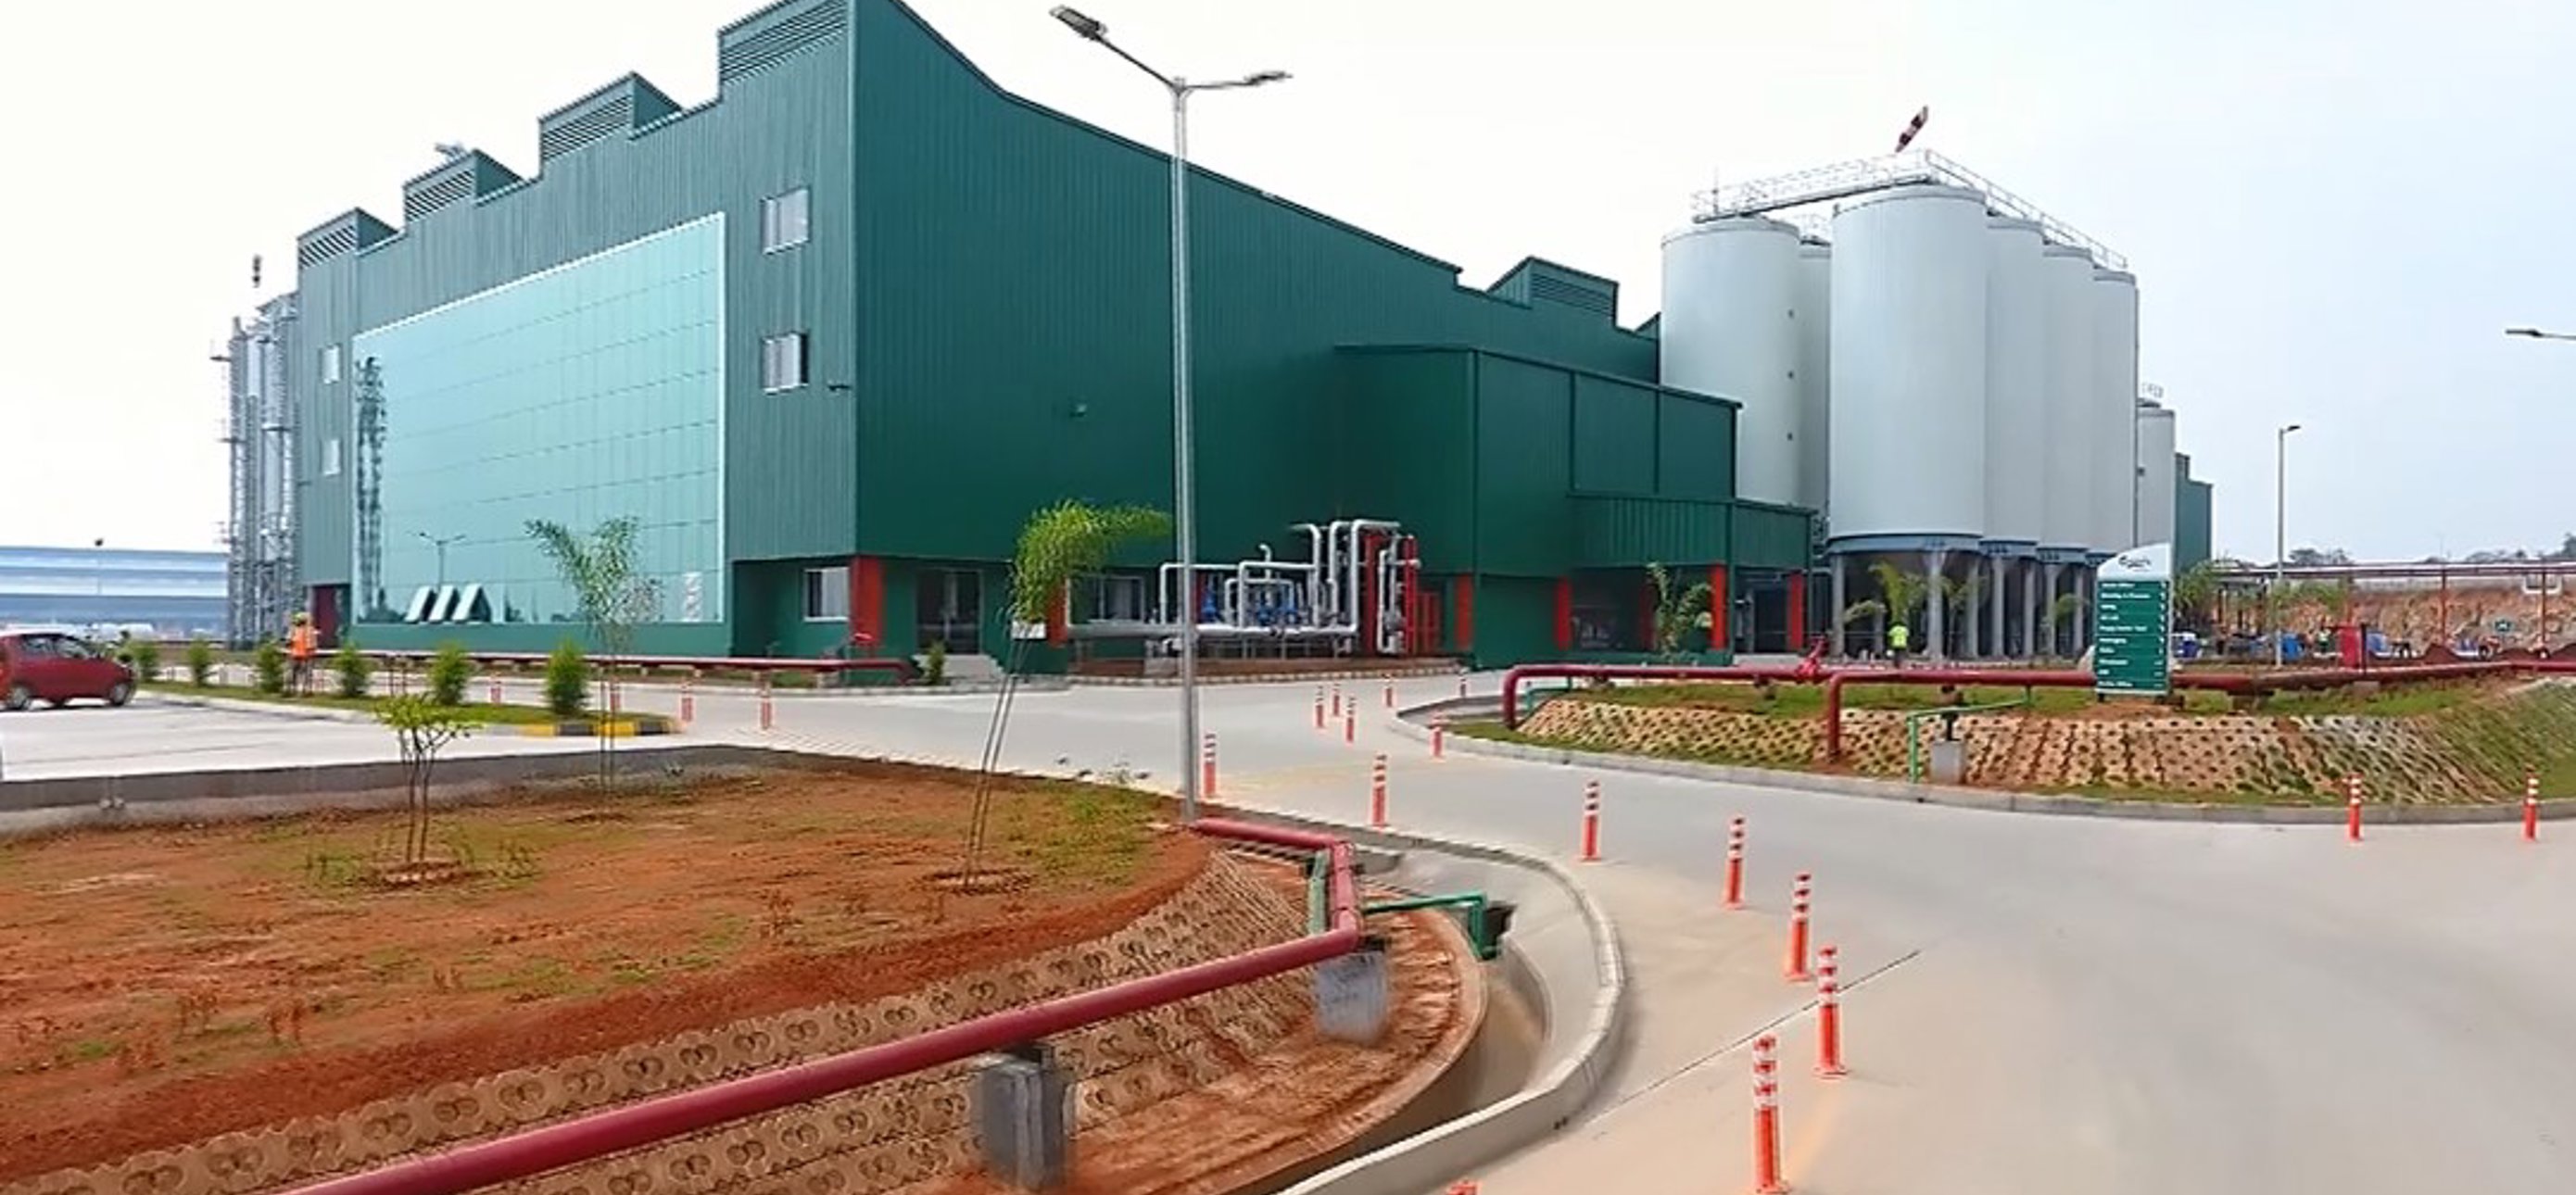
Carlsberg India is the Indian arm of the Danish Carlsberg Group, which has brewed in the country for about two decades. Its beers span mainstream to premium: Tuborg Strong, Tuborg Classic, Carlsberg Elephant, Carlsberg Smooth and 1664 Blanc. It sells through about 80,000 licensed outlets from seven owned breweries and eight third-party manufacturing facilities.
The group took outright ownership of its Indian division in 2024; before that it was a joint venture involving CSAPL (Singapore) Holding. In 2025 it committed ₹12.5 billion (US$140.7 million) to new and expanded capacity under an MoU with the Indian government, then converted the company to a public limited company and added four independent directors in 2026 ahead of the listing.
The company does not appear to give investors a growth-funding story. The structure is an exit by the seller: South Asian Breweries Pvt. Ltd. sells up to 8.64 crore shares, and the proceeds go to the seller, not to the company. That makes the quality of the business, and the price paid for it, the whole case.
3 TIMELINE
| Date | Event |
|---|---|
| c. 2006 | Brand-licence agreement with the Carlsberg group (effective royalty about 1.8%) |
| 2009–2018 | Period of the alleged anti-competitive practices referred to in press coverage; details not in the sources read |
| 2018 | Mysuru (Karnataka) brewery begins operations |
| 2024 | Carlsberg takes outright ownership of its India division (previously a joint venture) |
| Feb 2025 | Mysuru investment lifted to ₹6 billion (US$69 million) |
| Sep 2025 | ₹12.5 billion (US$140.7 million) capex MoU: Ahilyanagar greenfield (₹5 billion), Hooghly expansion (₹4 billion), Mysuru |
| Jun 2026 | Brand licence renewed at 4% (Tuborg) and 5% (Carlsberg), capped effective at 1.8% for five years; board broadened |
| Jul 2026 | Confidential DRHP pre-filing; reported target about US$700 million |
| 1 Oct 2026 | SEBI observations received |
| 27–29 Oct 2026 | Updated DRHP dated and filed |
4 OFFER STRUCTURE, PARTIES AND REPORTED PRICING
| Item | Detail | Figure | Comment |
|---|---|---|---|
| Offer type | Book-built offer for sale | Up to 8.64 crore shares | No fresh issue |
| Seller | South Asian Breweries Pvt. Ltd. | — | Named by Groww; parent holding % not stated in sources |
| Face value | Per share | ₹1 | Groww |
| Reported size | Press estimate | ~US$700 million (~₹6,600 crore) | Pre-filing figure; superseded by share count |
| Reported valuation | Press estimate | ₹30,000–35,000 crore (~US$3.8–4.0 billion) | Not in the filing |
| Lead managers | BRLMs | Kotak, Citi, J.P. Morgan | One Kotak Neo article lists others; treated as an error |
| Price band, dates | Not announced | — | Await RHP |
The price band, lot size, anchor allocation and issue dates were not published when this was written. All price-based numbers below are Rupeia arithmetic on reported estimates, not company guidance.
| RUPEIA CALCULATION US$700 million at about ₹96.5 per US$ is about ₹6,755 crore. If that is the value of 8.64 crore shares, the implied price is about ₹782 per share (₹6,755 crore ÷ 8.64 crore). On a ₹30,000–35,000 crore valuation, the offer would be 19–23% of equity (₹6,755 crore ÷ ₹35,000 crore = 19.3%; ÷ ₹30,000 crore = 22.5%). These figures come from different press reports, so they are a consistency check, not a forecast. |
|---|
5 FINANCIAL FORENSICS: THE NUMBERS AND WHAT THEY MEAN
| ₹ crore | FY25 | FY26 | Change / note |
|---|---|---|---|
| Net revenue | Not found | 3,892 | FY25 net figure not in sources |
| EBITDA | 682.55 | 813.25 | +19.1% |
| EBITDA margin on net revenue | Not found | 20.90% | Ties to EBITDA ÷ net revenue |
| Net profit (PAT) | 437.94 | 534.51 | +22.0% |
| PAT margin on net revenue | Not found | 13.73% | 534.5 ÷ 3,892 |
| Total income (Groww) | 9,018.15 | 8,814.96 | −2.3%; likely includes excise duty (inference) |
| Gross margin | Not found | 50.03% | Sources: INDmoney |
| Adjusted ROCE | Not found | 61.7% | Company definition; INDmoney |
| Q1 FY27 (to 30 Jun 2026): total income / EBITDA / PAT | — | 3,034.43 / 237.80 / 158.23 | Peak-season quarter; do not annualise |
Two things stand out. First, profit grew faster than EBITDA (22.0% against 19.1%), which usually means lower finance costs, lower tax or lower depreciation relative to operating profit. Second, total income fell 2.3% while EBITDA and profit rose: that pattern is what you see when a company shifts the mix toward higher-margin products or cuts costs, but the sources do not explain it, and the revenue definitions differ between the two summaries.
| RUPEIA CALCULATION Where does each ₹100 of FY26 net revenue go? Gross margin 50.03% means about ₹49.97 is the direct cost of making and packaging the beer. Operating costs (sales, distribution, people, overheads) take about ₹29.13 (50.03% − 20.90%). EBITDA is ₹20.90. Depreciation, interest and tax together take about ₹7.17 (20.90% − 13.73%), leaving net profit of ₹13.73. Rupeia calculation from the UDRHP-based percentages. |
|---|
6 BUSINESS MODEL & UNIT ECONOMICS
Carlsberg India earns money by brewing, packaging and selling beer under licensed brands through state-regulated channels.
| Line | How it earns | Pressure point |
|---|---|---|
| Strong beer (Tuborg Strong) | 72.6% of FY26 gross sales; mainstream price tier, high strength; backbone of volume | Concentration; state price/excise rules on strong beer |
| Mainstream lager (Tuborg Classic, Carlsberg Smooth) | Volume and distribution coverage | Competes directly with Kingfisher and Budweiser lines |
| Premium (Carlsberg Elephant, 1664 Blanc) | Higher price per bottle; premiumisation drive | Smaller base; needs on-trade (bars) recovery |
| Licensed outlets (~80,000) | Sales are made to licensed retailers and state corporations, depending on the state | State control over listing, pricing and payment terms |
| Owned plus contract brewing | Seven owned breweries plus eight third-party facilities add flexible capacity | Quality control and logistics at contract sites |
In most Indian states a beer company cannot sell directly to consumers or set the shelf price freely. Each state decides which brands can be sold, at what ex-brewery price, with what excise and from which outlets. A brewer's profit therefore depends as much on its relationship with state systems and on its brand mix as on volume.
7 MARKET & COMPETITIVE ANALYSIS
| Peer | Status | Position |
|---|---|---|
| United Breweries (Kingfisher) | Listed | Net revenue ₹9,240 crore; EBITDA margin 9.21%; PAT ₹413.4 crore (FY26, INDmoney); 21 owned breweries |
| AB InBev India (Budweiser, Corona, Hoegaarden) | Unlisted subsidiary | About 19% share (media estimate) |
| Bira 91 (B9 Beverages) | Private | Craft-led challenger; no figures in sources read |
| Hyundai Motor India, LG Electronics India, Nestlé India | Listed | Reference for how Indian investors price foreign-parent subsidiaries |
United Breweries is the only major listed beer peer. Carlsberg India's case rests on a profitability gap: smaller revenue, similar or higher profit, much higher EBITDA margin.
8 1. THE INDIAN BEER MARKET: SIZE, GROWTH AND STRUCTURE
Estimates of market size vary by method. Mordor Intelligence puts India's beer market at about US$7.14 billion in 2026, growing at a 6.46% compound annual rate to 2032. Persistence Market Research gives about US$7.7 billion for 2026, and IMARC gave ₹477 billion for 2025. Treat these as a range of roughly US$7–8 billion, not a measured figure.
| Item | Figure | Source / note |
|---|---|---|
| Market size 2026 | ~US$7.1–7.7 billion | Mordor; Persistence (vendor estimates) |
| Growth | 5.8–6.5% a year to 2032–33 | Mordor; Persistence |
| Standard-priced beer share (2026) | 67.28% | Mordor |
| Premium beer growth | 7.68% a year to 2032 | Mordor |
| FY26 volume | +4% to 474 million cases | Industry press: state policy changes made beer more affordable |
| Share estimates | United Breweries ~50%, Carlsberg ~22%, AB InBev ~19% | INDmoney, "media reports" |
Three features make the structure unusual. The market is a three-player oligopoly with a long tail of regional and craft brands. Beer is less than a fifth of Indian alcohol sales by value, so growth depends on conversion from spirits and illicit alcohol to beer. And pricing is set state by state, which means no brewer can pass cost increases straight to the shelf. ICRA's September 2026 sector update expects beer-led growth to offset weakness in mass-market spirits, with premiumisation intact.
9 2. BRAND PORTFOLIO AND CONCENTRATION RISK
Tuborg Strong accounted for 72.6% of FY26 gross sales. This is the single most important number in the prospectus for a buyer, because it concentrates the company's fortunes on one price point, one strength segment and a few large states.
| Brand | Tier | Role |
|---|---|---|
| Tuborg Strong | Mainstream, high strength | 72.6% of gross sales; volume engine |
| Tuborg Classic | Mainstream | Light-beer volume |
| Carlsberg Elephant | Premium strong | Premiumisation lever; named by the company as a driver of H1 2025 growth |
| Carlsberg Smooth | Mainstream/premium | Smaller |
| 1664 Blanc | Premium wheat beer | Aspirational / on-trade |
| RUPEIA CALCULATION Rupeia sensitivity: if Tuborg Strong sales fell 10% at constant prices, gross sales would fall about 7.3% (10% × 72.6%). On ₹3,892 crore of net revenue that is roughly ₹283 crore. If the lost sales carried the 50.03% gross margin and fixed costs did not move, EBITDA would fall about ₹141 crore, or 17.4% of ₹813.25 crore. This is an illustration of operating leverage, not a forecast. |
|---|
10 3. CAPACITY, BREWERIES AND THE CAPEX PROGRAMME
| Item | Detail | Source |
|---|---|---|
| Owned breweries | Seven (June 2026; also Sept 2025) | Groww; Just Drinks |
| Third-party facilities | Eight (June 2026) | Groww |
| Earlier counts | Eight breweries (Feb 2025); 14 in total (pre-filing press) | Global Drinks Intel; Multibagg |
| Installed capacity FY26 | 5,461 thousand hectolitres (about 546 million litres) | Earlier search summary of the filing; single source |
| Mysuru (Karnataka) | 28 acres; 800,000 hl (80 million litres) from 2018; to double to 160 million litres; ₹6 billion total commitment | Just Drinks; Global Drinks Intel |
| Ahilyanagar (Maharashtra) | New greenfield; ₹5 billion | Just Drinks (Sept 2025) |
| Hooghly (West Bengal) | Brownfield expansion; ₹4 billion | Just Drinks |
| Total capex MoU | ₹12.5 billion (US$140.7 million) | Just Drinks |
The brewery counts conflict because sources count owned plants, co-manufacturers and closed or planned sites differently. The prospectus table of facilities is the reference; the 2026 figure of seven owned plus eight third-party is the most recent in the sources.
| RUPEIA CALCULATION Rupeia calculation: Mysuru at 80 million litres is about 14.6% of the 546 million litres installed capacity. Doubling it adds 80 million litres, or about 14.6% to group capacity, before Ahilyanagar and Hooghly are counted. The ₹12.5 billion MoU is about 3.2% of FY26 net revenue, a modest outlay against a ₹813 crore EBITDA. |
|---|
11 4. UNIT ECONOMICS AND COST STRUCTURE
The prospectus-level percentages allow a simple view of how a rupee of net revenue is used.
| Per ₹100 of FY26 net revenue | ₹ | Derivation |
|---|---|---|
| Direct cost (materials, packaging, brewing) | 49.97 | 100 − 50.03 gross margin |
| Operating costs (sales, distribution, people, other) | 29.13 | 50.03 − 20.90 |
| EBITDA | 20.90 | Reported |
| Depreciation, interest and tax | 7.17 | 20.90 − 13.73 |
| Net profit | 13.73 | Reported |
The gross margin is 6 percentage points above United Breweries (44.05%) and the EBITDA margin is more than double (20.90% against 9.21%). The sources do not give a full reason. Candidate explanations, none confirmed, are a richer strong-beer mix, a lower fixed-cost base per litre because of newer plants, and a lower royalty burden than the contractual rate suggests.
12 5. CARLSBERG INDIA VERSUS UNITED BREWERIES
| FY26 | Carlsberg India | United Breweries | Gap |
|---|---|---|---|
| Net revenue | ₹3,892 crore | ₹9,240 crore | UB is 2.4x |
| EBITDA margin | 20.90% | 9.21% | +11.7 points |
| EBITDA (derived) | ~₹813 crore | ~₹851 crore | Similar |
| Net profit | ₹534.5 crore | ₹413.4 crore | Carlsberg +29% |
| PAT margin | 13.73% | 4.47% | +9.3 points |
| Gross margin | 50.03% | 44.05% | +6.0 points |
| Owned breweries | 7 | 21 | — |
Source: INDmoney, citing the Carlsberg UDRHP and public UB filings. UB EBITDA derived by Rupeia as 9.21% × ₹9,240 crore.
On absolute EBITDA the two are almost level (about ₹813 crore and ₹851 crore) and Carlsberg earns more net profit. The market pays for earnings quality, but a buyer should ask what UB's lower margin includes (for example, a broader mix, more owned plants and different cost allocations) before treating the gap as pure outperformance.
13 6. THE ROYALTY QUESTION
Carlsberg India pays a royalty to the Carlsberg group for the use of its brands. Under a 2006 agreement the effective rate was about 1.8%. In June 2026 the licence was renewed with contractual rates of 4% for Tuborg and 5% for Carlsberg, but a five-year side letter keeps the effective rate capped at 1.8%. About ₹90 crore was paid in FY26.
| Basis | Rate | Amount on ₹3,892 crore net revenue | Comment |
|---|---|---|---|
| Reported FY26 royalty | — | ~₹90 crore (2.3%) | Does not match 1.8% of either revenue measure |
| 1.8% effective cap | 1.8% | ~₹70 crore | On net revenue |
| Contractual blend | 4.27%* | ~₹166 crore | *Rupeia assumption: 72.6% at 4%, 27.4% at 5% |
| Increase over reported ₹90 crore | — | ~₹76 crore | 9.3% of EBITDA; ~₹57 crore after 25% tax = ~10.7% of FY26 PAT |
The ₹90 crore figure is 2.3% of net revenue, higher than the 1.8% cap; the base on which the percentage is applied (net revenue, gross sales or something else) is not stated in the sources, which is why the figures do not tie. The risk is what happens after the five-year side letter ends. If the contractual rates then applied in full, the illustrative cost is about ₹76 crore a year, a hit of about one-tenth of profit at FY26 scale. Because the parent is also the seller, a buyer should read the related-party disclosures and the side-letter terms in the prospectus closely.
14 7. WHY PARENTS LIST THEIR INDIAN SUBSIDIARIES: PRECEDENTS AND PRICING
INDmoney tabulates how Indian-listed subsidiaries of foreign groups trade against their parents. The gap is the logic behind the offer.
| Indian subsidiary | P/E (Indian) | Parent | P/E (parent) |
|---|---|---|---|
| Hyundai Motor India | 30x | Hyundai Motor Co (Korea) | ~10.3x |
| LG Electronics India | 62.9x | LG Electronics Inc (Korea) | ~16.7x |
| Hindustan Unilever | 33.9x | Unilever PLC (UK) | ~27.5x |
| Nestlé India | 82.2x | Nestlé SA (Switzerland) | ~23.7x |
| Maruti Suzuki India | 30.9x | Suzuki Motor Corp (Japan) | ~10.8x |
Source: INDmoney (Screener.in, CompaniesMarketCap); multiples as reported on the page and not re-checked by Rupeia.
Whalesbook's reading is that the offer prioritises liquidity for the parent over capital for India. That does not make the business worse, but it does mean there is no fresh money to expand capacity from the issue, and that the seller has chosen the timing.
15 8. VALUATION MATHS AND SENSITIVITY
Valuations of ₹30,000–35,000 crore are press estimates, not company guidance. The table shows what different values imply on FY26 figures.
| Valuation (₹ crore) | P/E on ₹534.5 cr PAT | EV/EBITDA* on ₹813.25 cr | x net revenue | Offer as % of equity at ₹6,755 cr |
|---|---|---|---|---|
| 25,000 | 46.8x | 30.7x | 6.4x | 27.0% |
| 30,000 | 56.1x | 36.9x | 7.7x | 22.5% |
| 35,000 | 65.5x | 43.0x | 9.0x | 19.3% |
| 40,000 | 74.8x | 49.2x | 10.3x | 16.9% |
*Market value used as a proxy for enterprise value because net debt or cash is not in the sources. Rupeia arithmetic.
| RUPEIA CALCULATION Rupeia calculation: at ₹35,000 crore the P/E is 65.5x. For a buyer to earn a 12% annual return over five years from earnings growth alone at a constant multiple, profit would need to compound at 12% a year; if the multiple compressed to 40x, profit would need to roughly 1.64x further to compensate (65.5 ÷ 40), on top of the 12%. That is why the price band matters more than any growth narrative. This is an illustration, not advice. |
|---|
16 9. GOVERNANCE, BOARD AND LEGAL HISTORY
Conversion and board: the company converted to a public limited company and added four independent directors in 2026. Whalesbook says they include veterans of PepsiCo, Vodafone, L'Oréal and Reckitt Benckiser; the sources do not name them. Whalesbook carries a disclaimer that its content may be AI-generated, so Rupeia treats this as unconfirmed.
Ownership: the seller is South Asian Breweries Pvt. Ltd.; the Carlsberg Group's total holding and the chain of holding companies are not stated in the sources.
Legal history: press describes alleged anti-competitive practices in the beer industry between 2009 and 2018. The sources do not give the outcome or amounts for Carlsberg India; the prospectus contingent-liabilities and litigation chapters are where they appear.
Related-party dealings: the royalty (section 6) is the largest identified item; others, if any, are not in the sources.
17 10. REGULATION AND POLICY MAP
| Area | Why it matters | Direction in sources |
|---|---|---|
| State excise and pricing | States set ex-brewery prices, excise and which brands may be sold | FY26 policy changes made beer more affordable; volume +4% |
| Licensing and outlets | Number and type of outlets are state-controlled | About 80,000 licensed outlets for Carlsberg |
| Packaging inputs | Aluminium cans and glass are major costs | Whalesbook lists aluminium volatility as a risk |
| Competition law | Industry-wide scrutiny of beer pricing in 2009–2018 | Outcome not in sources |
| Foreign ownership of alcohol entities | Approvals can be slow | Whalesbook lists as a risk |
18 11. QUESTIONS THE RED HERRING PROSPECTUS SHOULD ANSWER
Price band, lot size, anchor investors and the final number of shares.
FY25 and FY24 net revenue, so the growth rate is visible; net debt or cash.
Exact royalty base and the terms of the five-year side letter.
Volume by state and the top three states' share of revenue.
Gross sales split by brand and tier for FY24–FY26, and the cost of strong beer versus premium.
Capacity utilisation by plant and the commissioning date of Ahilyanagar and the Hooghly expansion.
Parent shareholding before and after the offer, and any lock-in.
Litigation and the competition-law outcome; contingent liabilities.
19 12. GLOSSARY
| Term | Meaning |
|---|---|
| OFS (offer for sale) | Existing shareholders sell shares; the company gets no money |
| DRHP / UDRHP | Draft red herring prospectus; updated draft after the regulator's comments |
| RHP | Red herring prospectus: near-final offer document with the price band |
| EBITDA | Earnings before interest, tax, depreciation and amortisation |
| Adjusted ROCE | Return on capital employed on the company's own adjusted definition |
| Hectolitre (hl) | 100 litres; 1,000 hl = 100,000 litres |
| Excise duty | State tax on alcohol levied at the brewery gate |
| Royalty | Fee for using a licensed brand |
20 VALUATION SCENARIOS
| Scenario | Valuation (₹ crore) | P/E on FY26 | What must be true |
|---|---|---|---|
| Bear | 25,000 | 46.8x | Concentration and royalty step-up weigh; market prefers a UB-like multiple |
| Base | 30,000 | 56.1x | Low end of the reported range; growth in premium offsets concentration |
| Bull | 35,000 | 65.5x | Press-estimate top end; premiumisation and margin hold |
Rupeia scenario table on FY26 profit of ₹534.5 crore; the reported range is ₹30,000–35,000 crore.
21 SCENARIO ANALYSIS
| Scenario | Probability | What happens |
|---|---|---|
| Bull | 25% | Listing at ₹35,000 crore or above; Tuborg Strong share falls as premium grows; margin maintained |
| Base | 45% | Listing at ₹28,000–32,000 crore; steady 8–12% volume growth; royalty step-up deferred |
| Bear | 30% | Pricing below ₹26,000 crore or deferral after market weakness; concentration or state-policy shock |
22 RISK ANALYSIS: RED FLAG LEDGER & KILL CONDITIONS
| Risk | Severity | Kill condition |
|---|---|---|
| Brand concentration: Tuborg Strong 72.6% of gross sales | High | Share of Tuborg Strong in the RHP; state price changes |
| Royalty step-up after the five-year side letter | High | Terms in the RHP; related-party note |
| Valuation: 56–65x FY26 profit at the reported range | High | Price band against ₹30,000–35,000 crore |
| State excise and pricing control | High | Any state raising excise or capping ex-brewery prices |
| Competition from United Breweries and AB InBev | Medium | Price wars; new launches |
| Aluminium and packaging costs | Medium | Gross margin below 48% |
| Legal and competition-law history | Medium | Contingent liabilities in the RHP |
| Secondary sale: no growth capital | Medium | Use of the seller's proceeds; lock-in terms |
23 INVESTOR CLASS ANALYSIS
HNIs and family offices
Wait for the price band. Compare it with the ₹30,000–35,000 crore press estimate and with the P/E you would accept for a business with concentration in one brand. Grey-market premiums are not information about the business.
Institutions
Anchor and long-only investors will focus on the royalty arrangement, the parent's post-offer stake and lock-in, and whether the margin gap with United Breweries is structural.
NRIs
NRIs can hold unlisted Indian shares under FEMA pricing and reporting rules; repatriation depends on the account route used.
24 THE EARLY SIGNAL: EVENTS TO WATCH
| When | Event |
|---|---|
| Nov–Dec 2026 | Possible RHP, price band and issue dates |
| Q3 FY27 results | First post-listing quarter if listed |
| 2027 | Ahilyanagar and Hooghly capacity progress |
| 2031 | Expiry of the five-year royalty side letter (if dated from 2026) |
25 RUPEIA FINAL INDEPENDENT VIEW
Carlsberg India is a high-return, high-margin brewer with the disclosure of a full prospectus and an unusually large concentration in one brand. The facts are strong; the open variable is price. Reported values imply 56–65x FY26 profit, which leaves little room for a royalty step-up or a Tuborg Strong setback.
| THE RUPEIA NUMBER 72.6%. The share of FY26 gross sales from one brand, Tuborg Strong. |
|---|
| RUPEIA VERDICT Strong business, price decides. Wait for the band. |
|---|
Frequently asked questions
Is Carlsberg India's IPO a fresh issue?
No. It is a pure offer for sale of up to 8.64 crore shares by South Asian Breweries Pvt. Ltd.; the company receives no proceeds.
What were Carlsberg India's FY26 revenue and profit?
Net revenue ₹3,892 crore, EBITDA margin 20.9% and net profit ₹534.5 crore, per the updated DRHP as summarised by INDmoney.
How big is the IPO and what is the valuation?
Press estimates are about US$700 million and ₹30,000–35,000 crore; neither is in the filing and no price band has been announced.
How does it compare with United Breweries?
On FY26 figures United Breweries has 2.4x the revenue but lower net profit (₹413.4 crore against ₹534.5 crore) and a much lower EBITDA margin (9.2% against 20.9%).
What is the biggest risk?
Concentration: Tuborg Strong was 72.6% of FY26 gross sales, followed by the royalty step-up when the five-year cap ends.
Does Carlsberg India pay a royalty to its parent?
Yes. Contractual rates are 4% (Tuborg) and 5% (Carlsberg) from June 2026, capped at an effective 1.8% for five years; about ₹90 crore was paid in FY26.
Source log
Groww: Carlsberg India files updated DRHP with SEBI
INDmoney: Carlsberg India updated DRHP, profitability vs Kingfisher
INDmoney: Why global companies are listing in India
Whalesbook: Board revamp signals valuation gap
Whalesbook: A US$700M play for parent liquidity
Just Drinks: Carlsberg outlines India capex plans
Global Drinks Intel: Carlsberg follows India unit buy with capacity investment
Kotak Neo: Carlsberg India IPO gets SEBI approval
Mordor Intelligence: India beer market
Persistence Market Research: India beer market
Multibagg: Carlsberg India DRHP details
| DISCLAIMER This report is independent research by Rupeia Investments Co. built only from public sources as of the date shown. It is not an offer, solicitation or investment advice, and it is not a recommendation to buy or sell any security. Private-company figures are drawn from filings and media reports and may be revised. Unlisted and private-market investments are illiquid and carry a risk of total loss. Investors should take independent advice. |
|---|